아이폰에서 OpenGL|ES 1.0을 사용하여 2D를 사용하기위해
먼저 3D의 기본지식을 설명하려 합니다.
http://en.wikipedia.org/wiki/OpenGL_ES <-외국어로 씌어져 있슴.
사용환경
xcode 3.2.5
iOS sdk 4.2
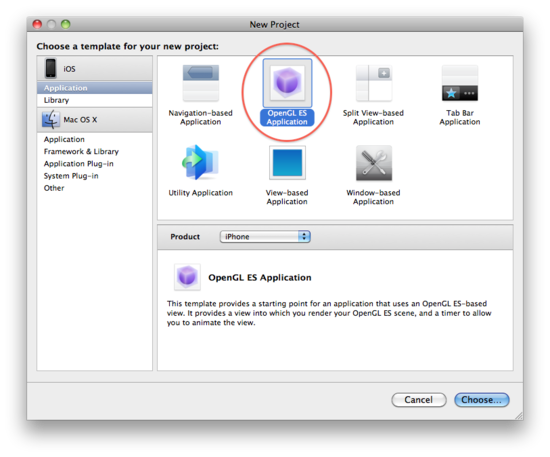
1.우선 OpenGL프로젝트 생성.
저는 GL2D 란 이름으로 생성함.
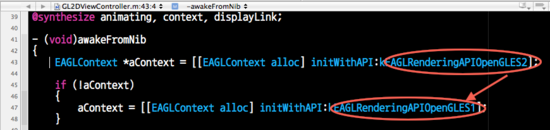
2.OpenGL|ES 1.0을 쓰기위해선 자동생성된 ViewController 43번째줄만 바꿔주면 됩니다.
45~48번줄은 삭제하고 kEAGLRenderingAPIOpenGLES2를 kEAGLRenderingAPIOpenGLES1로 바꿔줌.
//opengl|es 1.0 사용
EAGLContext *aContext = [[EAGLContext alloc] initWithAPI:kEAGLRenderingAPIOpenGLES1];
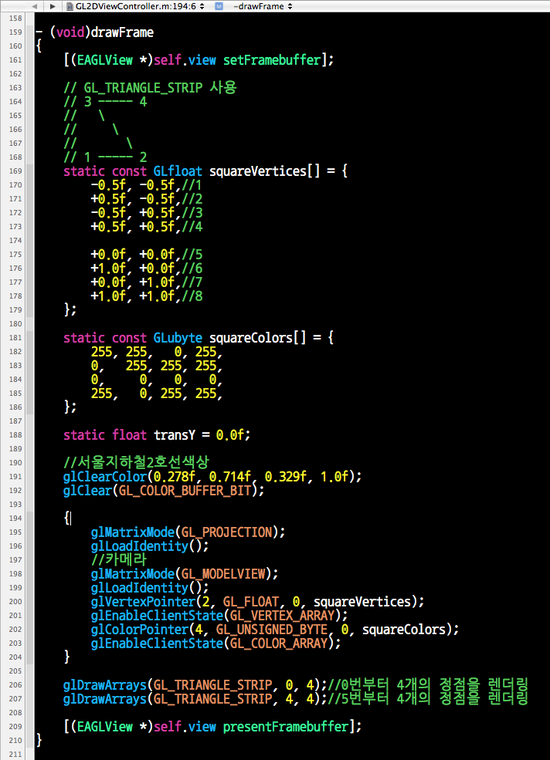
3.이번엔 실질적으로 렌더링하는곳을 몇군데 만져줍니다.
알기쉽게 사각형 순서를 코멘트하고,(163라인)
샘플의 사각형의 세로가 0.333 인게 기분나뻐서 0.5로 변경,(170~174라인)
3D좌표 설명용으로 검정색 정사각형을 하나로 추가하고(175~178라인)
배경색이 어두운게 기운이 안나서 서울지하철2호선색상으로 변경,(191라인)
2.0용 쉐이더 사용하는곳을 지워주고,(193라인근방)
위아래로 움직이는게 멀미할것 같으니 삭제,(200라인근방)
마지막으로 검정색 정사각형을 렌더링합니다.(207라인)-코멘트에 5번부터라고 써있는데 오타임;
4.빌드하고 실행하면 나오는 결과물입니다.
배경은 서울지하철 2호선 색상이고,
원래 샘플의 사각형보단 약간 길쭉하게 표시되고 정가운데에서 멈춰있으며,
제가 추가한 검정색 정사각형이 보입니다.
거기에 제가 코멘트에 적은 사각형 순서번호를 그렸습니다.
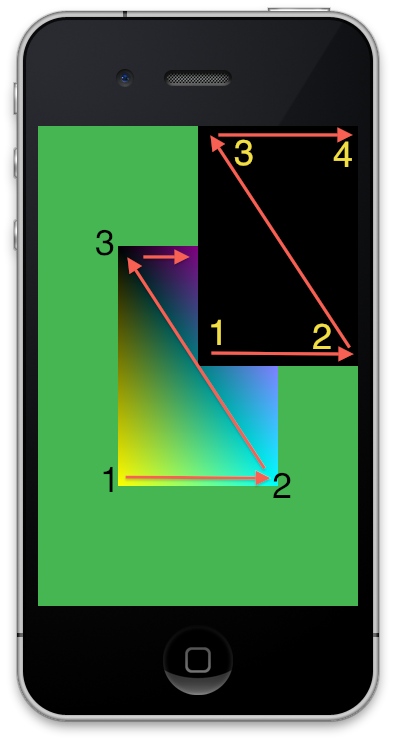
5.제가 추가한 사각형은 가로세로 1.0의 사이즈의 정사각형인데 직사각형으로 나옵니다.
원래 샘플의 사각형도 -0.5~0.5의 사이즈면 결국 1.0의 사이즈인데 마찬가지로 직사각형으로 나옵니다.
허나 이건 틀린게 아닙니다.
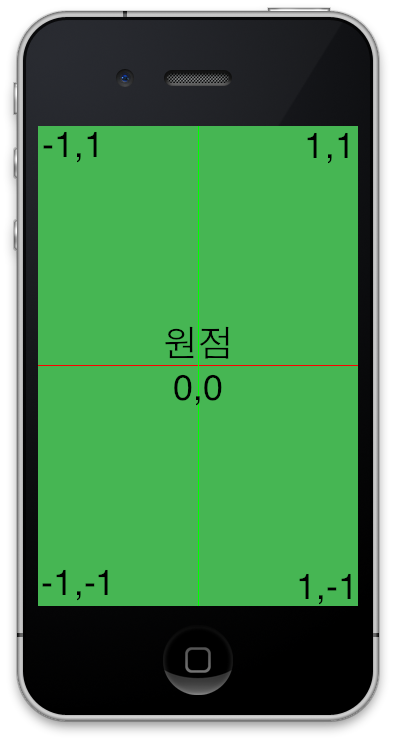
세로가 길던 가로가 길던 기본적인 3D좌표는
가운데가 원점
위아래(+1.0 ~ -1.0)
좌우(-1.0 ~ +1.0) 입니다.
( Z축은 왼손좌표일경우 앞뒤 +1.0 ~ -1.0 오른손좌표일경우 앞뒤 -1.0 ~ +1.0 )
제가 추가한 사각형은 사이즈가 1.0이니 위로 길죽하지만
원점을 기준으로 정확하게 1.0의 사이즈로 출력되었고,
원래 샘플의 정사각형도 원점을 기준으로 위아래좌우로 0.5씩의 사이즈로 출력되었습니다.
그러므로 결론은 여기까진 아무문제 없다 입니다.
다음번엔 소스코드에 한줄만 추가해서 정사각형으로 만들고,
알기쉬운 2D좌표를(왼쪽위가 원점)써서 출력을 해볼까 합니다;
[출처] OpenGL|ES 1.0 2D 튜토리얼 1/2|작성자 똥라면
'프로그래밍 > OpenGL-ES' 카테고리의 다른 글
| OpenGL|ES 1.0 2D 텍스쳐 맵핑 1/2 [출처] OpenGL|ES 1.0 2D 텍스쳐 맵핑 1/2|작성자 똥라면 (0) | 2011.01.22 |
|---|---|
| OpenGL|ES 1.0 2D 튜토리얼 2/2 [출처] OpenGL|ES 1.0 2D 튜토리얼 2/2|작성자 똥라면 (0) | 2011.01.22 |
| 백버퍼 접근 (0) | 2010.08.03 |
| 게임 프로젝트 생성할때, (게임은 OpenGl,Ui 는 xib 로...) (0) | 2010.07.20 |


 , then this mapping is given by

 and
and 


